Chart Scale & Projections
Compare Mercator, Lambert conic and polar stereographic charts, and see scale and convergence change with latitude
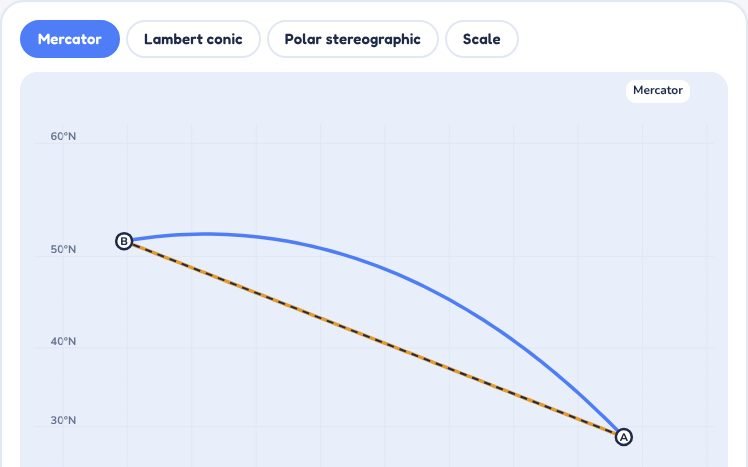
Chart Scale & Projections is part of lifetime access
Log in if you already have lifetime access, or unlock all 53 simulators, the full question bank and every flashcard for ₹3,499.
Or try the free ones: Wind Triangle and Altimeter.
Your account is on the free plan. Unlock all 53 simulators, the full question bank and every flashcard for ₹3,499, once.
More Navigation simulators
Great Circle & Rhumb LineLifetimeTime Zones & SunriseLifetimeCompass ErrorsLifetimeWind TriangleFreeWhat to try
- Choose Mercator, Lambert conic or polar stereographic and see the same route drawn on each chart.
- Compare the straight line with the great circle and the rhumb line. The gap is the conversion angle.
- On the Lambert tab, move the two standard parallels and watch the constant of the cone n and the scale change.
- Open the Scale tab to turn centimetres on the chart into nautical miles on the ground and back.
Exam point
Memory aid: Mercator has zero convergence and scale grows as the secant of latitude. Lambert has convergence n × change of longitude, with n close to the sine of the middle latitude. Polar stereographic has convergence equal to the change of longitude.
Study aid only. Figures here are simplified and fictional, so always use current DGCA and ICAO documents and the approved manual for real operations.